|
|
|
THE GEOMETRY OF SLUMS
Boundaries, Packing & Diversity
Fabiano SOBREIRA
Centre for Advanced Spatial Analysis - University College London - UK
e-mails: f.sobreira@ucl.ac.uk ; fabianosobreira@excite.com
Marcelo GOMES
Departamento de Fisica - Lab. Fisica Computacional - Univ. Federal de Pernambuco – Brazil
e-mail: mafg@npd.ufpe.br
ABSTRACT
Squatter settlements (pueblos jovenes, bidonvilles, kampungs, favelas…), because of their complex spatial configuration, have been ever referred as morphologically disordered structures. In this work it is shown that such settlements can be, in fact, defined as complex and logical structures, considering the patterns which arise from the spontaneous aggregation of dwellings, forming clusters (islands) with different sizes and shapes. We argue that squatter settlements, when constrained by urban boundaries, present the scaling property, i.e., there is a logical correlation between the frequency of units (built and open spaces) and their sizes, i.e., they follow scaling-laws. Such scaling properties, when applied to planning purposes, can be useful on describing and predicting spatial and social features and can be converted on planning tools for the governance of the informal city.
KEY WORDS: squatter settlements, scaling laws, fragmentation, diversity, spatial analysis.
1. INTRODUTION
In most developing country cities the housing deficit has been addressed by the people themselves through the spontaneous production of shelter. It is thus that a high proportion, and in many cities the majority, of urban dwellers in developing countries live in informally produced shelter. The pueblos jovenes of Peru, the kampungs of Indonesia, the bidonvilles of Algeria and the favelas of Brazil are just a few examples of informal settlements that house a significant proportion of the population in these cities (Imparato, 1995).
Nowadays, the conventional and outdated approach to settlement eradication has been replaced by the idea of gradual and participative improvement. According to the United Nations (UNCHS, 1982), the promotion and support of community-level activities in the informal production and improvement of shelter and shelter-related infrastructure is the more suitable approach for dealing with the housing deficit and urban poverty in these areas. But, still according the UNCHS (United Nations Centre for Human Settlements), even though political will in many cities is increasingly in favor of the recognition and upgrading of informal settlements, administrations are still struggling with the practical requirements of implementation. Many of the constraints faced by cities in this respect are related to the lack of capabilities in such land management tasks as mapping, planning and cadastral registration. One of the main constraints to the improvement of informal settlements is the lack or inaccuracy of the maps and cadastral data, as area, number of houses and population, that are necessary for the planning and implementation of upgrading projects (Imparato, 1995).
This work shows that squatter settlements present possible universal scaling properties which, when applied to planning purposes, can be useful on describing and predicting spatial and social features. So, it is possible estimating global properties as total area, number of houses and population from general or local information of these settlements. This approach is based on the assumption that squatter settlements are not merely disordered structures. In fact, they can be defined as complex systems, as they present the scaling property. We show it by analyzing the frequency of units (built and void spaces) according to their sizes, i.e., by using scaling-laws.
The scaling property means a kind of hierarchical order in the distribution of size of the subunits of a system. In recent years a great deal of effort in pure and applied science has been devoted to the study of nontrivial spatial and temporal scaling laws which are robust, i.e. independent of the details of particular systems (Bak, 1997; Batty, 1994; Frankhauser, 1998; Gomes et alli, 1999; Mandelbrot, 1983). These studies at present involve a multitude of complex systems formed by a large number of small units communicating via short-range interactions and submitted to both deterministic rules and random influences. As examples of particular interest we can cite the study of the geometry of railway networks (Benguigui, 1995), as well as the study of the dynamics of traffic jams (Nagel, 1992), and the modeling of urban growth patterns (Makse, 1998), among many others, all them exhibiting several types of scaling laws or power-law behavior. On the other hand, in the last few decades, the idea of disorder associated to the spatiotemporal configurations of cities has been replaced by the concept of complexity (Alexander, 1971; Hillier, 1996; Jacobs, 1996).
In the next section we report some results of this study on the geometry of squatter settlements. Our analysis focuses and quantifies in particular the fragmentation occurring in both the open and the built space of these urban structures. The data used in the first part of this present work came from an ensemble of nine squatter settlements or "favelas" distributed in different areas of the metropolitan region of Recife, on the northeastern coast of Brazil. In the last section we present a brief comparison between these data and those from the configurational analysis of two squatter settlements situated along the Mathare Valley in Nairobi, central region of Kenya.
2. RESULTS AND DISCUSSION
In order to give a general view of the kind of urban structure we are dealing with, we show in Figure 1 an image of the nine settlements examined in this first part of the present study. Each small cell of irregular shape in this figure represents an actual single house, and more precisely the space limited by roofs. As can be seen from these images, the settlements exhibit a seemingly disordered or spontaneous fragmented structure, characterized by the diversity of size of islands (group of connected houses) and the irregularity of their distribution and shape. These islands present a variable number s of units (s=1 means an isolated house, s=2 means a pair of contiguous houses, and so on). A careful examination of the Figure 1 reveals that s varies in the interval from 1 to 19. We can observe a great number of small islands in each settlement, as well a small number of big ones, and what is important: a logical distribution between the big and the small ones, what is a typical feature of complex systems. Another important characteristic of the settlements studied is this first section is that all them are embedded in urban networks and most of them submitted to very rigid boundary conditions. So, the development of these settlements occurs not as a spreading, but as a kind of packing process. Consequently we argue that, as the spatial limit of the settlement is previously defined, the diversity of size of its islands seems to be the response of the system to optimize the occupation.
|
|
Figure 1: The nine spontaneous settlements from Recife, northeast of Brazil. See text, section 2 for details.
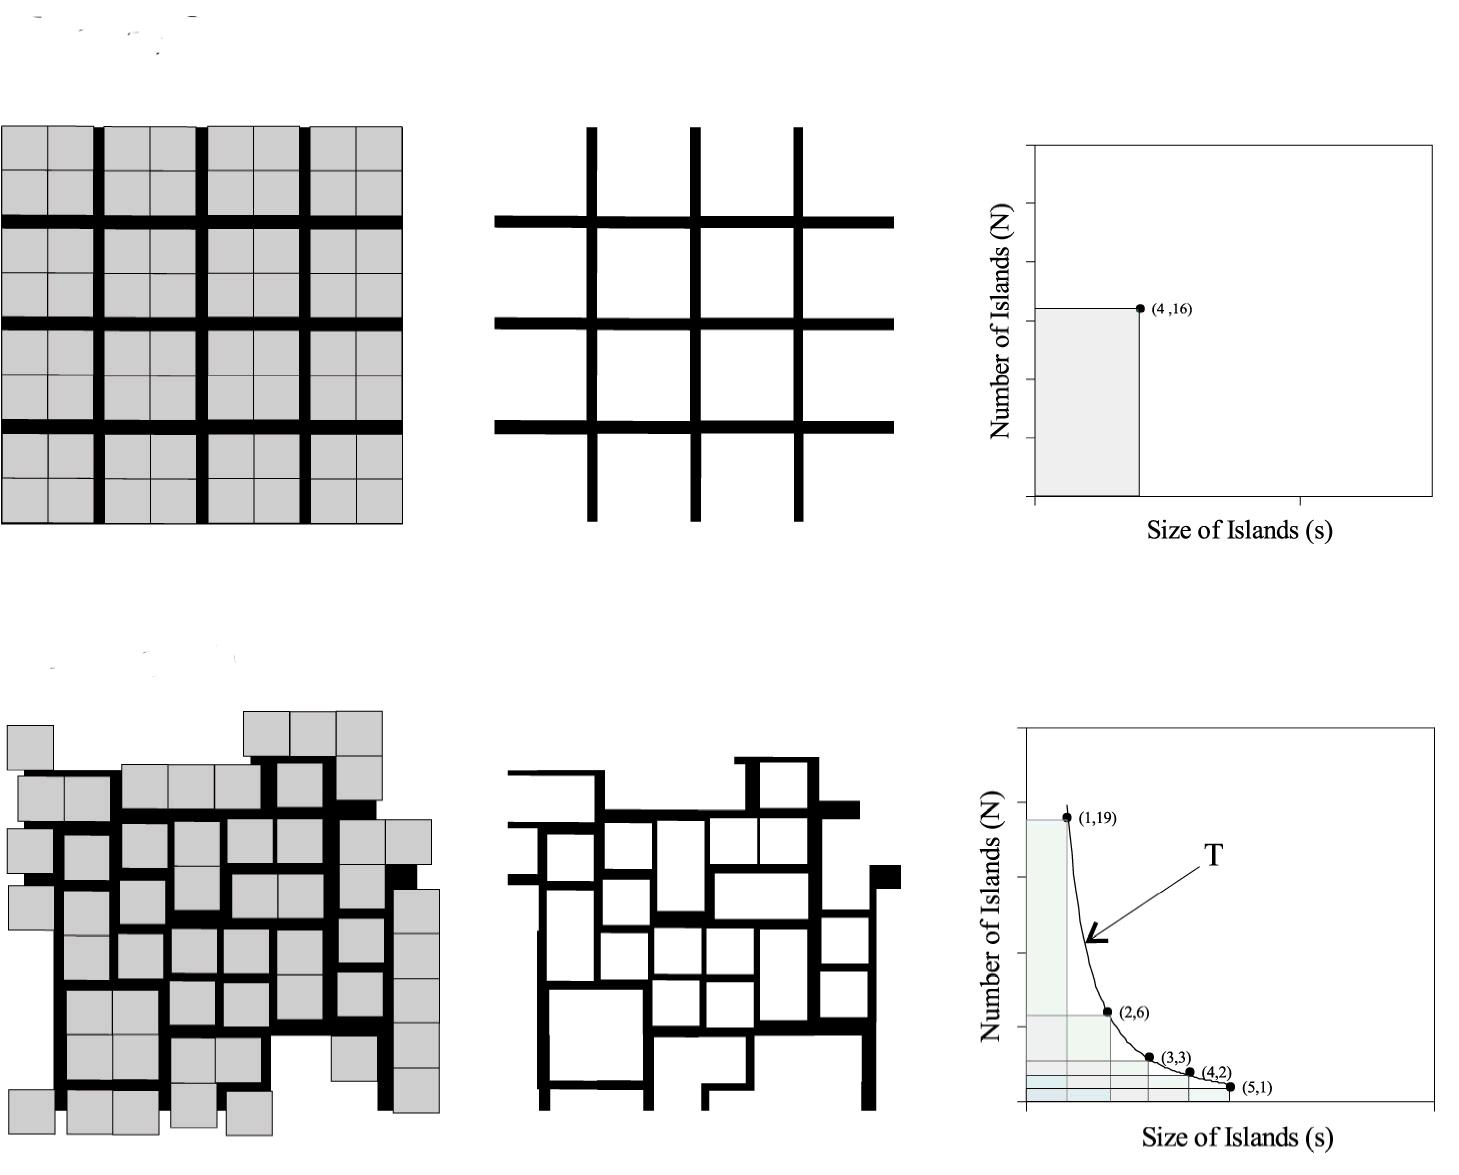
To make clear to the general reader non-familiarized with the mathematical language, we in the following present a geometrical example for the statistical method suggested in this work. As example, it is shown a comparison between two hypothetical geometrical structures representing, respectively, the regular and irregular settlements (see figure 2).
|
|
Figure 2: Two hypothetical geometrical structures, representing a regular settlement and an irregular one. Each one is represented by the map of islands, the grid of void spaces and the graph representing the number of islands (N) according their sizes (s). See text, section 2-A for details.
Figure 2 shows, on the top, a regular grid composed by a group of identical islands, distributed in a square area. In this case, it is really very simple to obtain global parameters from the local units of this regular structure. For example: as we can observe, each island contains four cells (houses) and all the islands are identical to each other. Considering that each cell has area (ah) of 10m2, one can easily conclude that the area of each island (Ai) is 40 m2 (Ai = 4.ah), and the total built area (A) is 640 m2 (A=16.4.ah). Dividing the total area by the area of each house (A/ah), we get the number of houses (64 units). If the average population per house is 3, one can easily calculate the total population of the settlement (P=3.4.16=192). Another way to calculate general parameters is via graphs, as the first one inserted on figure 2. This graph plots the number of islands (Ni) according to their sizes (s), and the shaded area represent the total number of habitations (Nh=Ni.s=16.4=64). It is a simple procedure, as the linear function generates a regular shape. So, it is not a hard task to understand why planners have preferred the regular shape when designing urban structures, despite the great range of social constraints and problems that it cause. This kind of geometrical scheme has been very common through the history of urban planning not just due to the esthetical approach, but mainly because it can be easily reproduced, controlled, analyzed, measured and planned.
When analyzing the bottom section of figure 2, which refers to the irregular settlement, one can note that the overall structure is not bounded by a regular square and the local units (islands) are different in size to each other. So, it seems impossible obtaining global parameters from just knowing information about a simple local unit. Apparently, the only way to obtain global properties is by describing each one of the units on the system. For example: to calculate the total built area (A) for the irregular settlement in figure 2b, one have to multiply the size (s) of each class of fragment (island) by the total number of fragments in that class, n(s), and by the dwelling average area (ah) sum over all classes of size.
But, as we have argued, there is a difference between disordered systems and complex ones. When they are complex, they follow rules that can be measured by non-linear functions, and we suggest that such irregular settlements (as the one presented on the bottom of figure 2b, representing the squatter settlements of figure 1) have statistical properties of complex systems. For example: we can see in the graph of figure 2b - number of islands (Ni) according to their sizes (s) – that the sum of area of rectangles (shaded areas) defined by the coordinates (x,y) on the graph (groups of islands according to their sizes) represents the total number of habitations (Nh). But the peculiarity of this new graph is that the coordinates (x,y) follow a curve that defines the power law (because there is a logical distribution between the great number of small islands and the small number of big ones). So, to calculate the total hatched area (statistically equivalent to the total number of dwellings of the respective structure) we just need to know the curve of the function, i.e., the exponent T. In this work we have found that all the settlement studied present a similar distribution of sizes, i.e., they follow non-linear functions with similar exponent T, whether related to built or to open spaces.
It is important to verify that the fragmentation observed on the maps of squatter settlements is not only characterized by the different sizes of islands, but also by the irregularity on shape of those islands and their informal distribution on space. Such irregularity is clearly observed when the open space is analyzed. The linear distribution of regular islands usually generate grids that can be easily modeled geometrically, while the irregular ones form a kind of deformed structure that seems to be quite disordered (see figure 2). But, as it will be shown in this first part of the analysis, such structure of open spaces can be described by non-linear geometrical patterns, directly related to the informality of the respective built structure.
So, to quantify the geometry of the settlements we investigated initially their open spaces, formed by alleys, courts and other interstitial regions surrounding the islands of habitations. To do this we performed a covering of the original continuous area by a set of contiguous convex (polygonal) spaces as suggested by Hillier & Hanson (1997). According to these authors, a convex map for a structure defined on the plane is the least set of fattest spaces that covers the system. To adapt the convex space concept to the fragmentation approach applied here, we considered as void areas all the spaces without roofs. Thus, convex spaces, in our approach, are not only the common area, but also the areas behind fences (gardens, courts, etc). Figure 3 shows the convex maps of the nine settlement studied.
|
|
Figure 3: The covering of the open space of the nine settlements by convex (polygonal) spaces with a distribution of areas f(a). See text, section 2-B for details.
Each covering in the present work is a family of fragments with a wide diversity of sizes, defined on this analysis by the variable area ac. It is observed that such fragmentation, in a particular settlement, is characterized by a statistical distribution f(ac) which gives the frequency of convex spaces within each interval of area ac. In spite of the nonuniqueness property of these coverings, we have observed that the distribution f(ac) is robust. Moreover, f(ac) has the scaling property and satisfies
f(ac) ~ ac -b , b =1.6 ± 0.2 , (1)
with the exponent beta independent of the settlement within the indicated statistical fluctuations. This scaling property suggest that the diversity of sizes of the resulting convex spaces follow a robust distribution of areas and indicates a great number of small convex spaces, and a small number of big ones.
Scaling or power-law behavior with nontrivial exponents is a characteristic of complex systems and means that the systems exhibiting such distributions have no characteristic scale or size (Gomes et alli, 1995; Mandelbrot, 1983). The explanation of these scaling laws with nontrivial exponents is one of the great challenges in the study of complex systems. Figure 4 shows a log-log plot of the measured distribution <f(ac)> of areas of convex spaces after dividing these spaces by classes of areas or bins and averaging over the entire ensemble of settlements given in Figure 3. In the horizontal axis of figure 4 the values ac for areas were normalized with respect to the area of the largest convex space for each settlement. To help the reader in developing insight on the distribution of areas of convex spaces we exhibit in the inset of Figure 4 a nonaveraged f(ac) – in this case for the settlement 1 shown in Figure 3. As can be seen from these figures, both <f(ac)> and f(ac) are essentially equal and have the same scaling exponent b , within the statistical fluctuations.
|
|
Figure 4 : Log-log plot of the measured, averaged, and normalised distribution of areas for convex spaces, <f(a)>, for the ensemble of nine settlements shown in Fig. 1. <f(a)>~a-b , with b = 1.6±0.2 as represented by the continuous line in the main plot. The inset gives f(a) for the settlement 2 shown in Fig.3. See text, section 2-B for details.
Inspired in statistical studies of fragmentation dynamics in physical systems and in order to obtain a more complete description of the geometrical properties of the urban structures studied here, we measured another distribution function, namely f(s), the frequency of islands with s contiguous habitations for each settlement. The discrete variable s gives a measure of the size or area of an island. This distribution is consequently defined for a region that is complementary to the void space defined in the previous paragraph.
We have found that the distribution f(s) also obeys a scaling relation; it is given by f(s)~s-t , with t = 1.6 ± 0.2 independently of the settlement. Thus, the value of the exponent t is close to the value of b appearing in equation 1 within the statistical fluctuations. This means that, as the open structure, all the settlements analyzed present a similar distribution pattern for built elements, what suggests that the diversity of built spaces generate an equally diverse structure of open spaces. It is interesting to observe that such similarity of distributions between the convex spaces and the islands (defined by the similarity of exponents) suggests a strong relation between built and void structures. Such correlation can also be supported by the similar degree of break-up verified on the settlements, that can be measured by the relation between the number of convex spaces and the number of buildings (Hillier et al, 1997) in each settlement. We noted that practically all settlement studied present a high and similar level of breakup, i.e., the number of cells (houses) is close to the number of convex spaces. In a regular grid, the number of convex spaces is considerably reduced when compared to the number of cells of the system. Scaling distributions of fragments with an exponent similar to this are commonly found in statistical models and in experiments of fragmentation dynamics of physical, chemical and ecological interest (Stosik et alli, 1995). As an illustration we can cite that the distribution of size of fragments for different types of collapse of two-dimensional brittle solids as cement plates also presents a hyperbolic dependence with the size or area of the fragments with an exponent t varying in the interval 1.5 to 1.8 (Brito et alli, 1996). The origin of this numerical value however is not yet clear. Another important illustration is the distribution of areas of the urban settlements around Berlin and London recently discussed by Makse et alli (1998), when it is presented an exponent near to 1.9. However, they deal with a scaling distribution in a very large scale, when compared with the "microscopic" scale of lengths within the settlements examined in the present work, whose peculiarities are commented ahead. The distribution of islands of habitations averaged on the ensemble of settlements shown in Figure 1 and normalized to the total number N of islands in each settlement, <f(s)>, is depicted in Figure 5. The continuous line in figure 5 represents the best fit
<f(s)> = <f(1)> . s-t , <f(1)> = 0.49 ± 0.08 , t = 1.6 ± 0.2 ; 1<s<smax (2)
where <f(1)> is the average number of islands with a single habitation, divided by the total number N of islands (<n(1)/N>). The largest size, smax, can be a measure of the diversity of size of the islands, D (i.e. D can represent the number of different classes of size for the islands). In particular, smax converges to D when the level of complexity increases. From now on we will identify smax with D in all equations.
|
|
Figure 5: Log-log plot of the measured, averaged, and normalised distribution of sizes of islands with s habitations <f(s)> for the ensemble of Fig.1. The continuous line represents the best adjust given by the power-law <f(s)> = <f(1)>.s-t , with <f(1)> = 0.49, and t = 1.6. See text, section 2-C for details.
The non-normalized distribution, <n(s)>, satisfies in general the constraint <n(s=D)>=1, that is, there is on the average a single island with the maximum size s=D in the scaling. This result leads to 1=<n(1)>.D-t , or
<n(1)> = Dt , (3)
i.e., there is a simple relationship connecting the number of smallest islands (s=1), n(1), with the observed diversity of size of islands, D. When the first quantity increases (decreases), the second also increases (decreases), and the degree of coupling between n(1) and D is controlled by the nontrivial exponent t of the distribution. We can say, as a consequence, that n(1) and D are two sides of a same coin. To increase the diversity of size of islands in a spontaneous settlement we need to increase the total number of islands, and this last quantity is mainly controlled by the number of isolated habitations n(1). The dependence of n(1) with D given in (3) allows equation 2 to be written as
<n(s)> = <n(1)> s-t = (s/D) -t , t =1.6± 0.2, (4)
what means that if one knows the diversity (generally equivalent to the size of its biggest island) of a squatter settlement, it is possible to estimate the number of islands with any size s, and vice versa.
The diversity of sizes as represented by the variable D here (see definition in the second paragraph of section 2-B) has been identified in studies of fragmentation dynamics with the overall complexity of the process or structure (Gomes et alli, 1995). It is of interest studying how this diversity of size increases with the total number of islands, Ni. To examine this relationship we define for each settlement represented in Figure 1 a family of arbitrary balls with irregular contours in a such way that the family of balls contains successively Ni=1, 5, 10, 15, 20, 25..., 100 islands. The dependence of D with Ni is shown in Figure 6 in a log-log plot for all settlements; the diamond marks in this figure refer to the ensemble averages. The continuous line in Figure 6 represents the best fit D = 1.1Ni0.49, for 1<Ni<80. This relation says that the diversity of size of islands in a spontaneous settlement increase as the square root of the total number of islands. This last scaling law is in agreement with several recent experiments (Brito et alli, 1996) and computer simulations (Stosik et alli, 2000) that have studied the evolution of the diversity in a fragmented system when its global size (e.g. the number of fragments) increases.
|
|
Figure 6: The diversity of sizes of islands of habitations, D, as a function of the number of islands, Ni. The continuous line represents the best fit D = 1.1Ni0.49. See text, section 4 for details.
3. OBTAINING PARAMETERS OF INTEREST
As one have suggested, irregular settlements within the spatial constraints and statistical fluctuations present the same pattern of fragmentation. These patterns occur on both the built and open spaces, and define their size distribution. We argue, as well, that it is possible estimating global properties from general or local information of these settlements. Consequently, we can estimate global parameters as total area, number of houses and population. Obviously, the more developed the settlement (high level of diversity, great number of dwellings, and consequently more data), the more precise will be the simulation.
The reader can observe that the distribution (4) is extremely economical: it depends only on a single parameter, namely D (the diversity of size of the settlement), or <n(1)> (the number of islands with just one house), since all settlements have a common exponent t . With equation 4 valid on the average for all settlements studied, we can calculate several statistical parameters of interest after a simple integration, as we will show in the following.
The total area A occupied by the islands in a certain settlement is given by
 (5)
(5)
![]() (6),
(6),
where ah is the average area per house. Since ah can be easily guessed, equations 5 and 6 show that the total built area of a settlement is controlled by a single parameter, the diversity of size of island, D, or n(1). Moreover, the total number of habitations in a settlement, Nh=A/ah, takes the simple forms
![]() , or (7)
, or (7)
![]() (8)
(8)
If the average population per house, p, is estimated by any mean, the total population, P, can be expressed in terms of the diversity D (or, equivalently, <n(1)>):
![]() , or (9)
, or (9)
![]() (10)
(10)
Thus, the total population P is known if D (or <n(1)>) is given and vice-versa. Another quantity of interest is the total number of islands in a given settlement, Ni, which is expressed as
 , or (11)
 (12)
(12)
An interesting result concerning the density of islands of size s=1 comes from equation 12: in leading order, this equation reads Ni = <n(1)> / t - 1 (since 1/t = 0.625, and the term <n(1)>1/t can be neglected in respect to the linear term <n(1)>, that is
 . (13)
The density n(1)/Ni varies in the nine settlements studied from 0.46 to 0.66 with an average of 0.57 in agreement with equation 13. Furthermore, if we substitute (13) in (8), we obtain the total number of habitations, Nh, as a function of the total number of islands Ni:
![]() . (14)
. (14)
From equation 14, with t = 1.6, we get e.g. Nh = 305 for settlement 6 (N = 110), and Nh = 245 for settlement 8 (N = 94). The actual values of Nh for settlements 6 and 8 are respectively 323 and 215, i.e. equation 14 gives Nh-values with a typical uncertainty of 6-10%. In summary, if the distribution of islands or fragments for a particular fragmented system is known, all the statistical quantities of interest can be obtained. Hyperbolic distributions of the type given in (2) or (4) are specially robust and universal when they appear in a certain class of problems [1]. We conjecture that all spontaneous settlements that present the same kind of spatial constraints, are described by a single hyperbolic distribution of the type given in equation 4 with the scaling exponent t assuming the robust value t = 1.6 ± 0.2.
4. BOUNDARIES, PACKING & DIVERSITY
It is important to remember that the evolution process of the settlements analyzed in this work is not related to spreading, because the boundaries around the settlements limit the growth. Actually, it is a process of packing within a limited space for development. So, when the number of islands increase, the general (potential) size of the settlement remains the same and the density of the system raises, as each new building added to the system is submitted to the constraints of spatial availability. If a settlement were composed only by islands of size 1 (isolated houses), the resulting density would be considerably low, due to the large amount of void spaces, and we could conclude that in this case the occupation would be not optimized. On the other hand, if a structure were composed by a few amounts of really big islands, the rate of density would be really high. However, the resulting occupation would not be appropriate, due to some problems of access, privacy and salubrity caused by the lack of void spaces connecting houses. This would be, as well, a kind of non-optimized occupation. So, we can conclude that the best response to optimize the occupation of a decentralized system is through the diversity of size of its islands. We can verify this relation about boundaries, packing and diversity by analyzing an actual example: the squatter settlements along the Mathare Valley in Nairobi, Kenia. In this case, we have compared the structure of two settlements (A and B), with the same age, but with distinct configurational patterns. In figure 7 it is shown a general view of the valley and the area around it. The settlements A and B are highlighted (the shaded and circled areas) in the general map and have their built structure detailed in specific plans, in which the shaded objects represent the islands of habitations. The settlement A is completely constrained by rigid boundaries: it is surrounded on the left and bellow by high-density urban structures; above by the Gitathuru river; bellow by the Juja road and on the right by property limits. On the other hand, the settlement B is completely free of boundaries, whether natural, urban or property related.
|
|
Figure 7: General view of the Mathare Valley (Nairobi – Kenya) and the area around it. The settlements A and B are highlighted (the shaded and circled areas) in the general map and have their built structure detailed in specific plans, in which the shaded objects represent the islands of habitations. See text, section 4 for details.
By analyzing the detailed maps of built structures, we clearly observe a great difference on the configurational structure of these settlements: the settlement B is practically composed by islands of isolated habitation [s=1], spread in a low-density structure; and the settlement A is highly packed (dense) and present islands with size from 1 to 8 (high level of diversity comparing to B). And what is more important: the frequency of islands [f(s)] according to the sizes follow a power law (see figure 8) defined by an exponent (1.4) similar to the exponent found for the settlements in Brazil. These results seem to indicate a deterministic order, where boundary is the cause, packing is the effect and diversity is the route.
|
|
Figure 8 - Log-log plot of the measured, and normalised distribution of sizes of islands with s habitations <f(s)> for the settlement A ensemble of Fig.7. The continuous line represents the best adjust given by the power-law <f(s)> = <f(1)>.s-t , with <f(1)> = 0.44, and t = 1.4. See text, section 4 for details.
5. CONCLUSIONS
The fragmentation of squatter settlements in northeastern Brazil is investigated and compared to settlements in the central region of Kenya, and several nontrivial scaling functions describing these urban structures are found. The statistical analysis used here for these settlements is inspired on recent studies of fragmentation dynamics mainly in physical systems.
We have shown that there are robust (possibly universal) distribution functions associated to the fragmented structures of these spontaneous settlements. Using these distribution functions, many statistical quantities of interest can be obtained. In particular, we have stressed the importance of the variable diversity of size in obtaining these quantities of interest. We conjecture that the hyperbolic distribution functions given in equations 1 and 4 are robust and universal, that is, they control the statistical aspects discussed here in all squatter settlements irrespective cultural particularities.
An important characteristic of the settlement studied is that all them are embedded in urban networks and most of them submitted to very rigid boundary conditions. The development of these settlements occurs not as a spreading, but as a kind of packing process. Consequently, as the spatial limit of the settlement is previously defined, the diversity of size is the response of the system to optimise the occupation. If there is not rigid boundaries, the response is trivial: houses distributed by a disordered way, isolated in islands of size 1. Anyway, a detailed analysis of other spontaneous settlements in different regions is needed to test the robustness of the present conjecture.
References
Alexander, C. (1971) , Ensayo Sobre La Síntesis de La Forma (Notes on The sYnthesis of Form). 2nd ed. Buenos Aires: Ediciones Infinito.
Bak, P. (1997), How Nature Works: The science of self-organized criticality. Oxford: Universirty Press.
Batty, M. and Longley, P. (1994) Fractal Cities – A Geometry of Form and Function. 1st ed. London: Academic Press.
Benguigui, L. (1992), The fractal dimension of some railway networks. J. Phys. I France, 2, 385–388.
Benguigui, L. (1992), Some speculations on fractals and railway networks. Physica A, 191, 75–78.
Benguigui, L. (1995), A new aggregation model. Application to town growth Physica A, 219, 13-26.
Brito, V. , Gomes, M. , Souza, F. and Adhikari, S. (1998), Diversity of fragments in the collapse of brittle solids, Physica A, 259, 227-234.
Gomes, M. , Souza, F. and Adhikari, S. (1995), Formation and maintenance of complex systems. Journal of Physics A: Mathematical and General, 28, L613.
Gomes, M. , Garcia, J. , Jyh, T. , Rent, T. , and Sales, T. (1999) , Diversity and Complexity: Two sides of the same coin? In: The Evolution of Complexity, 8, 117-123, Dordrecht: Kluwer Academic.
Hiller, B. (1996), Space is the machine. 1ed. London: Cambridge University Press.
Hillier, B. and Hanson, J. (1997), The social logic of space. London: Cambridge University Press.
Imparato, I. (1995), Urban Poverty Reduction : The Potential of Informal Settlement Upgrading, Settlement Upgrading Programme (SUP) – United Nations centre for human Settlements – HABITAT (Accessed from home-page: www.unchs.org/unchs/english/suphome/povty.htm at 10/11/00).
Jacobs, J. (1996), The death and life of great american cities. New York: Vintage Books.
Makse, H. , Andrade, J. , Batty, M. , Havlin, S. , and Stanley, E. (1998), Modeling urban growth patterns with correlated percolation. Physical Review E, 58, 7054-7062.
Mandelbrot, B. (1983) , The Fractal Geometry of Nature. New York: Freeman.
Meibom, A. and Balslev, I. (1996) Composite Power Laws in Shock Fragmentation. Phys. Rev. Lett., 14, 2492.
Stosik, B. , Gomes, M. and Adhikari, S. (2000), Quantum tunneling fragmentation model Physical Review E , 61, 6111, and references therein.
UNCHS -United Nations Centre for Human Settlements (1982), Survey of Slum and Squatter Settlements. Dublin: Tycooly International Publishing Ltd.